1. Introduction
Algorithmic bias (“AI bias”) is a phenomenon that occurs when “an algorithm produces results that are systematically prejudiced due to erroneous assumptions in the machine learning process.” One might be led into believing that artificial intelligence (“AI”) based tools should produce unbiased results given they are machine-driven; however, this myth needs to be busted because these tools learn from ‘examples’ (“dataset”) instead of following instructions. As Cassie Kozyrkov, chief intelligence engineer at Google explains, datasets are textbooks for ‘machine’ students to learn from and the way normal textbooks have human authors who might have their own biases, so would datasets. Therefore, it is not surprising if a student or a machine develops skewed views when it is taught prejudiced content. Therefore, users have been cautioned from using these AI tools. But this has not hindered AI tools’ rising popularity or the industry from solving for AI bias. With much of the world embracing the ethos of ‘diversity’, solutions to fixing AI bias too are in making the datasets diverse.
2. Diversity in datasets
The what, the why, the how
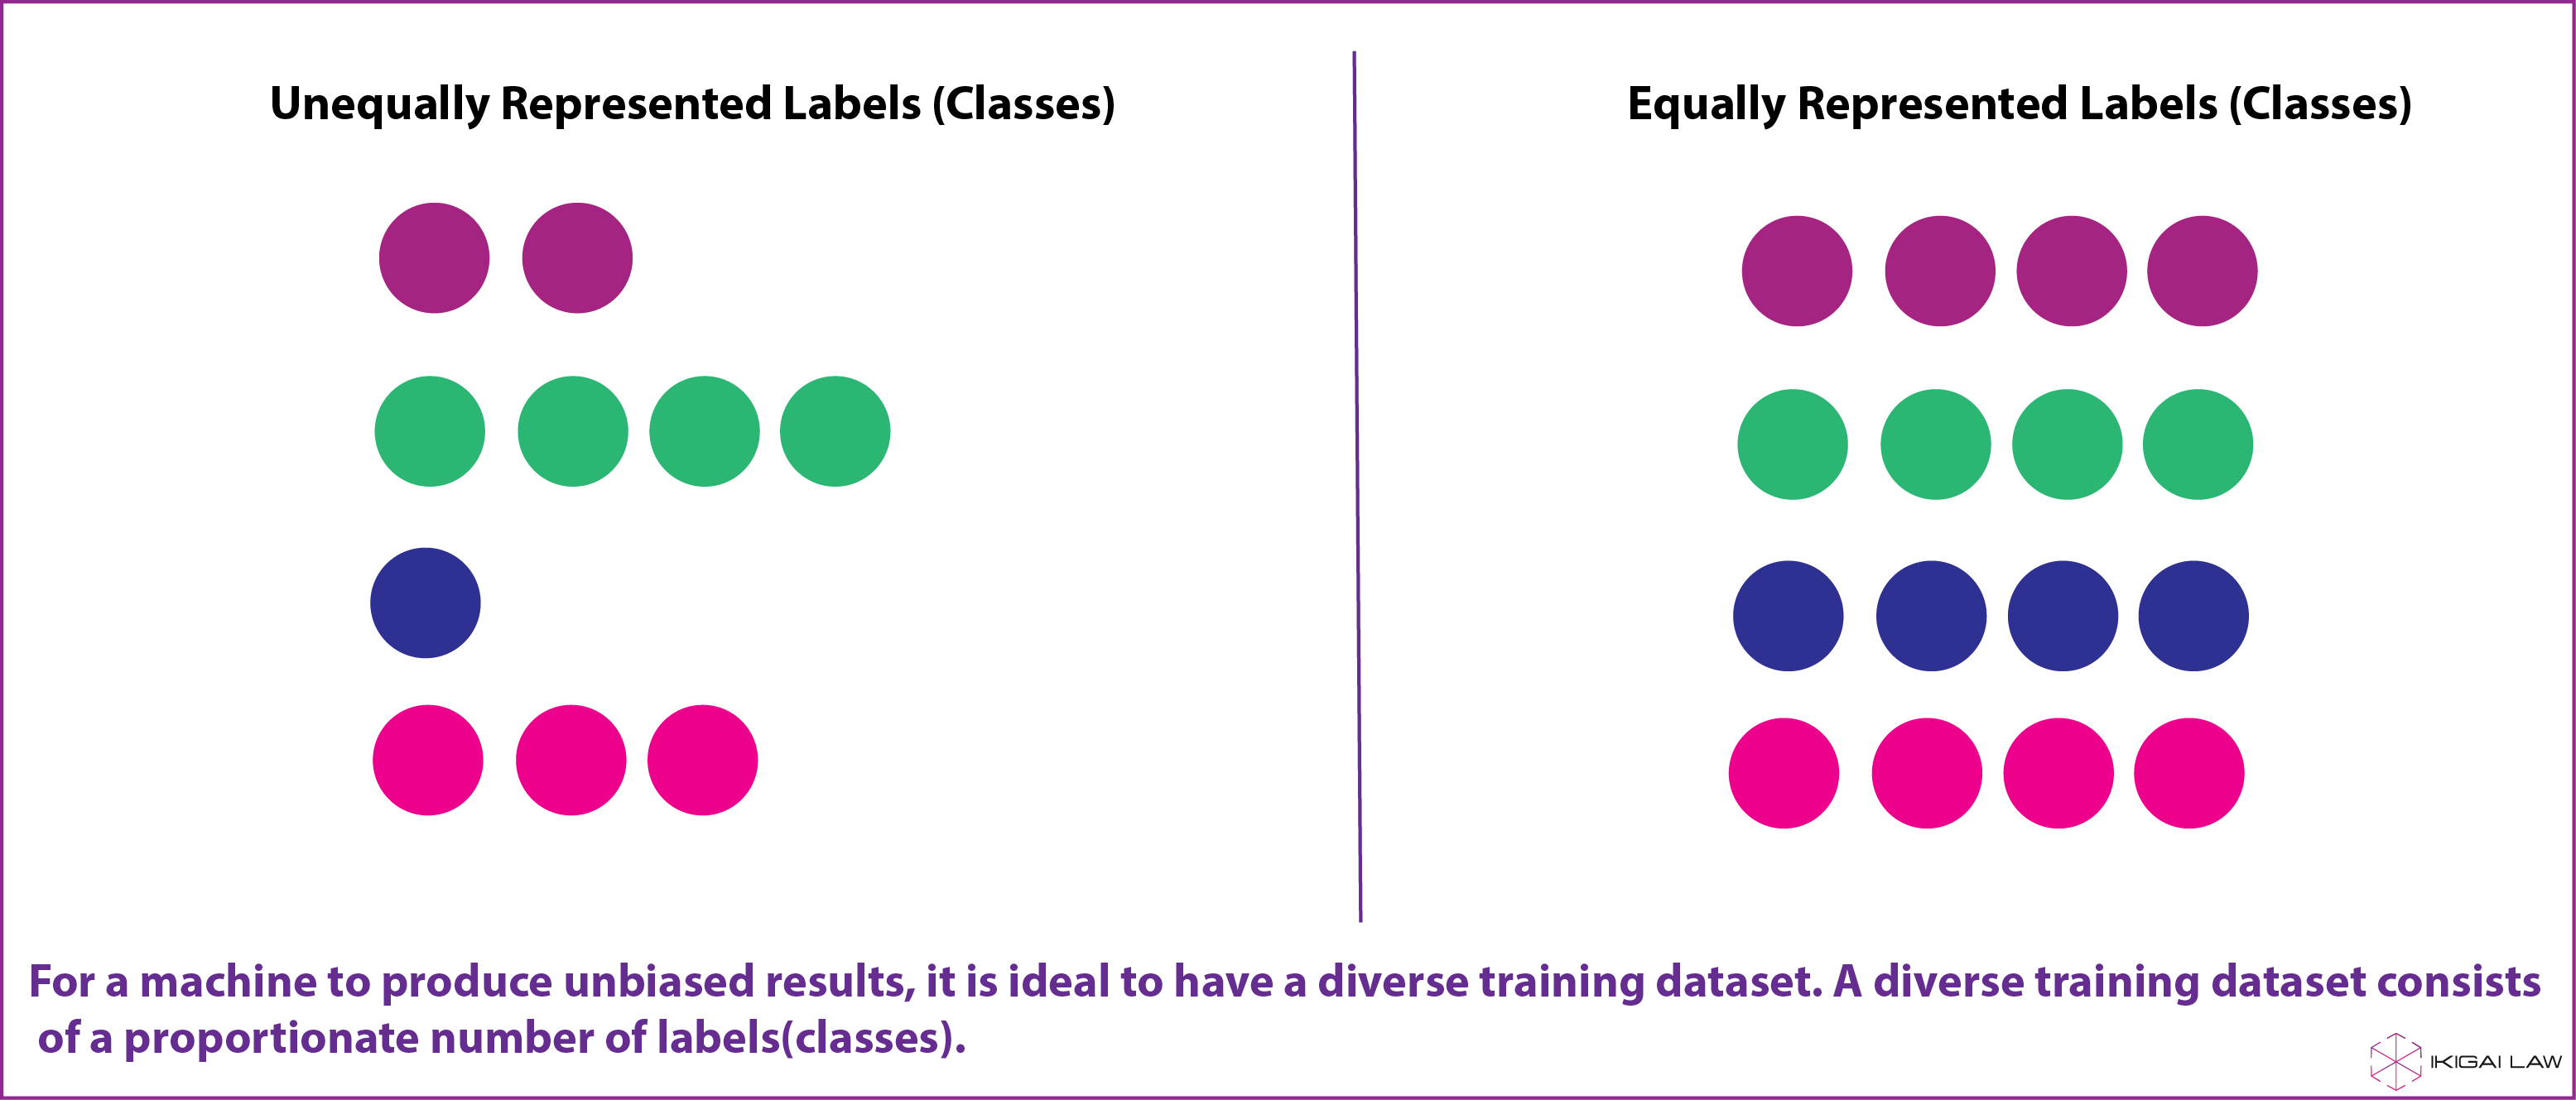
An algorithm is as good as the data you put into it. AI tools depend on clean, accuracy and well-labelled data to produce accurate results. That is also why AI projects spend the most time on collecting and building a holistic dataset. A dataset that has a proportionate number of different ‘classes’ (“labels”) is likely to be more diverse. For example, a training dataset required to build an email filter would have labels such as “spam” and “not spam”, whereas a training dataset of different animals would have labels such as “cat”, “dog”, “horse”, etc. A diverse dataset is likely to have a comparable number of each of these labels within the dataset.

Having a balanced frequency of each class within the training dataset is crucial for any AI tool to produce accurate results. Amazon’s facial recognition system, which was being used by the police to identify criminals, produced 40 per cent false matches for faces of colour. This was due to a lower frequency of coloured faces (and other minority groups) as compared to white faces in the system’s training dataset. It is also opined that facial recognition systems are accurate at identifying races who develop them, which in Amazon’s case was ‘white men’. Therefore, companies such as IBM have now invested heavily in making their training datasets more diverse.
Consider the following graphic (source) to understand generally how more data affects performance and accuracy.

The objective in the above slide is to fit a curve that would resemble the green curve’s path. If we were to fit a curve passing through the only blue point, which is one data point, as shown in figure (a), we would encounter multiple curves that would meet the criteria. As we increase the number of data points, the number of curves that satisfy the condition reduces, as shown in figure (b), finally fitting a curve approximating the green curve as shown in figure (c). With increasing the data points, the algorithm is in a better position to generalize an output that would approximate the user’s requirements. The same analogy applies to facial recognition systems, where supplying the algorithm with more diverse faces allows it to identify more distinct facial features (such as colour variation, the position of organs, size of organs, etc.) hence increasing its accuracy. Having fewer instances of coloured faces is similar to having a single blue dot (as shown in figure (a)) where the algorithm is more likely to consider a dark face like that of a gorilla’s (similar to fitting multiple possible but incorrect curves as shown in figure (a)). Therefore, having a substantial number of all labels would be imperative for the algorithm to be accurate.
Another problem that could arise with having a disproportionate frequency of labels is with the algorithm incorrectly categorizing the minority cases as an ‘anomaly’. Since these algorithms function on generalization, an algorithm when pressurized to produce an output within a short amount of time might altogether reject the minority labels categorizing them as outliers which may lead to lower overall accuracy.
Usually obtaining a diverse dataset is a difficult task. Sometimes it could be due to sheer lack of information on certain labels, such as days that witness natural calamities, or sometimes the information could be expensive to obtain. Broad level solutions to solve for AI bias have asked for bringing more diversity in AI tools developer teams in terms of skills, angles, gender, ethics, discipline, etc. Similarly, tech-level solutions too have been towards devising methods that would modify the training dataset such that it becomes well-balanced. This can be achieved by but is not restricted to:
1. Thoughtfully adding under-represented labels of data.
An example of this method can be seen in Google’s Quick, draw! experiment. This experiment was aimed to educate a wide international audience on ANNs. People were asked to doodle commonplace objects while the system simultaneously tried to recognize these objects in under 20 seconds. As part of the doodling process, the experiment gathered over 115000 doodles of a shoe, however, the developer team realized that ‘sneakers’ were overwhelmingly represented in this dataset. Given this high frequency of sneakers, the system was biased to identify only sneakers as a shoe. Here, the developer team had to seek additional training doodles of other styles of shoes to fill in gaps and make the dataset diverse.
2. Generating a diverse child dataset from larger parent dataset.
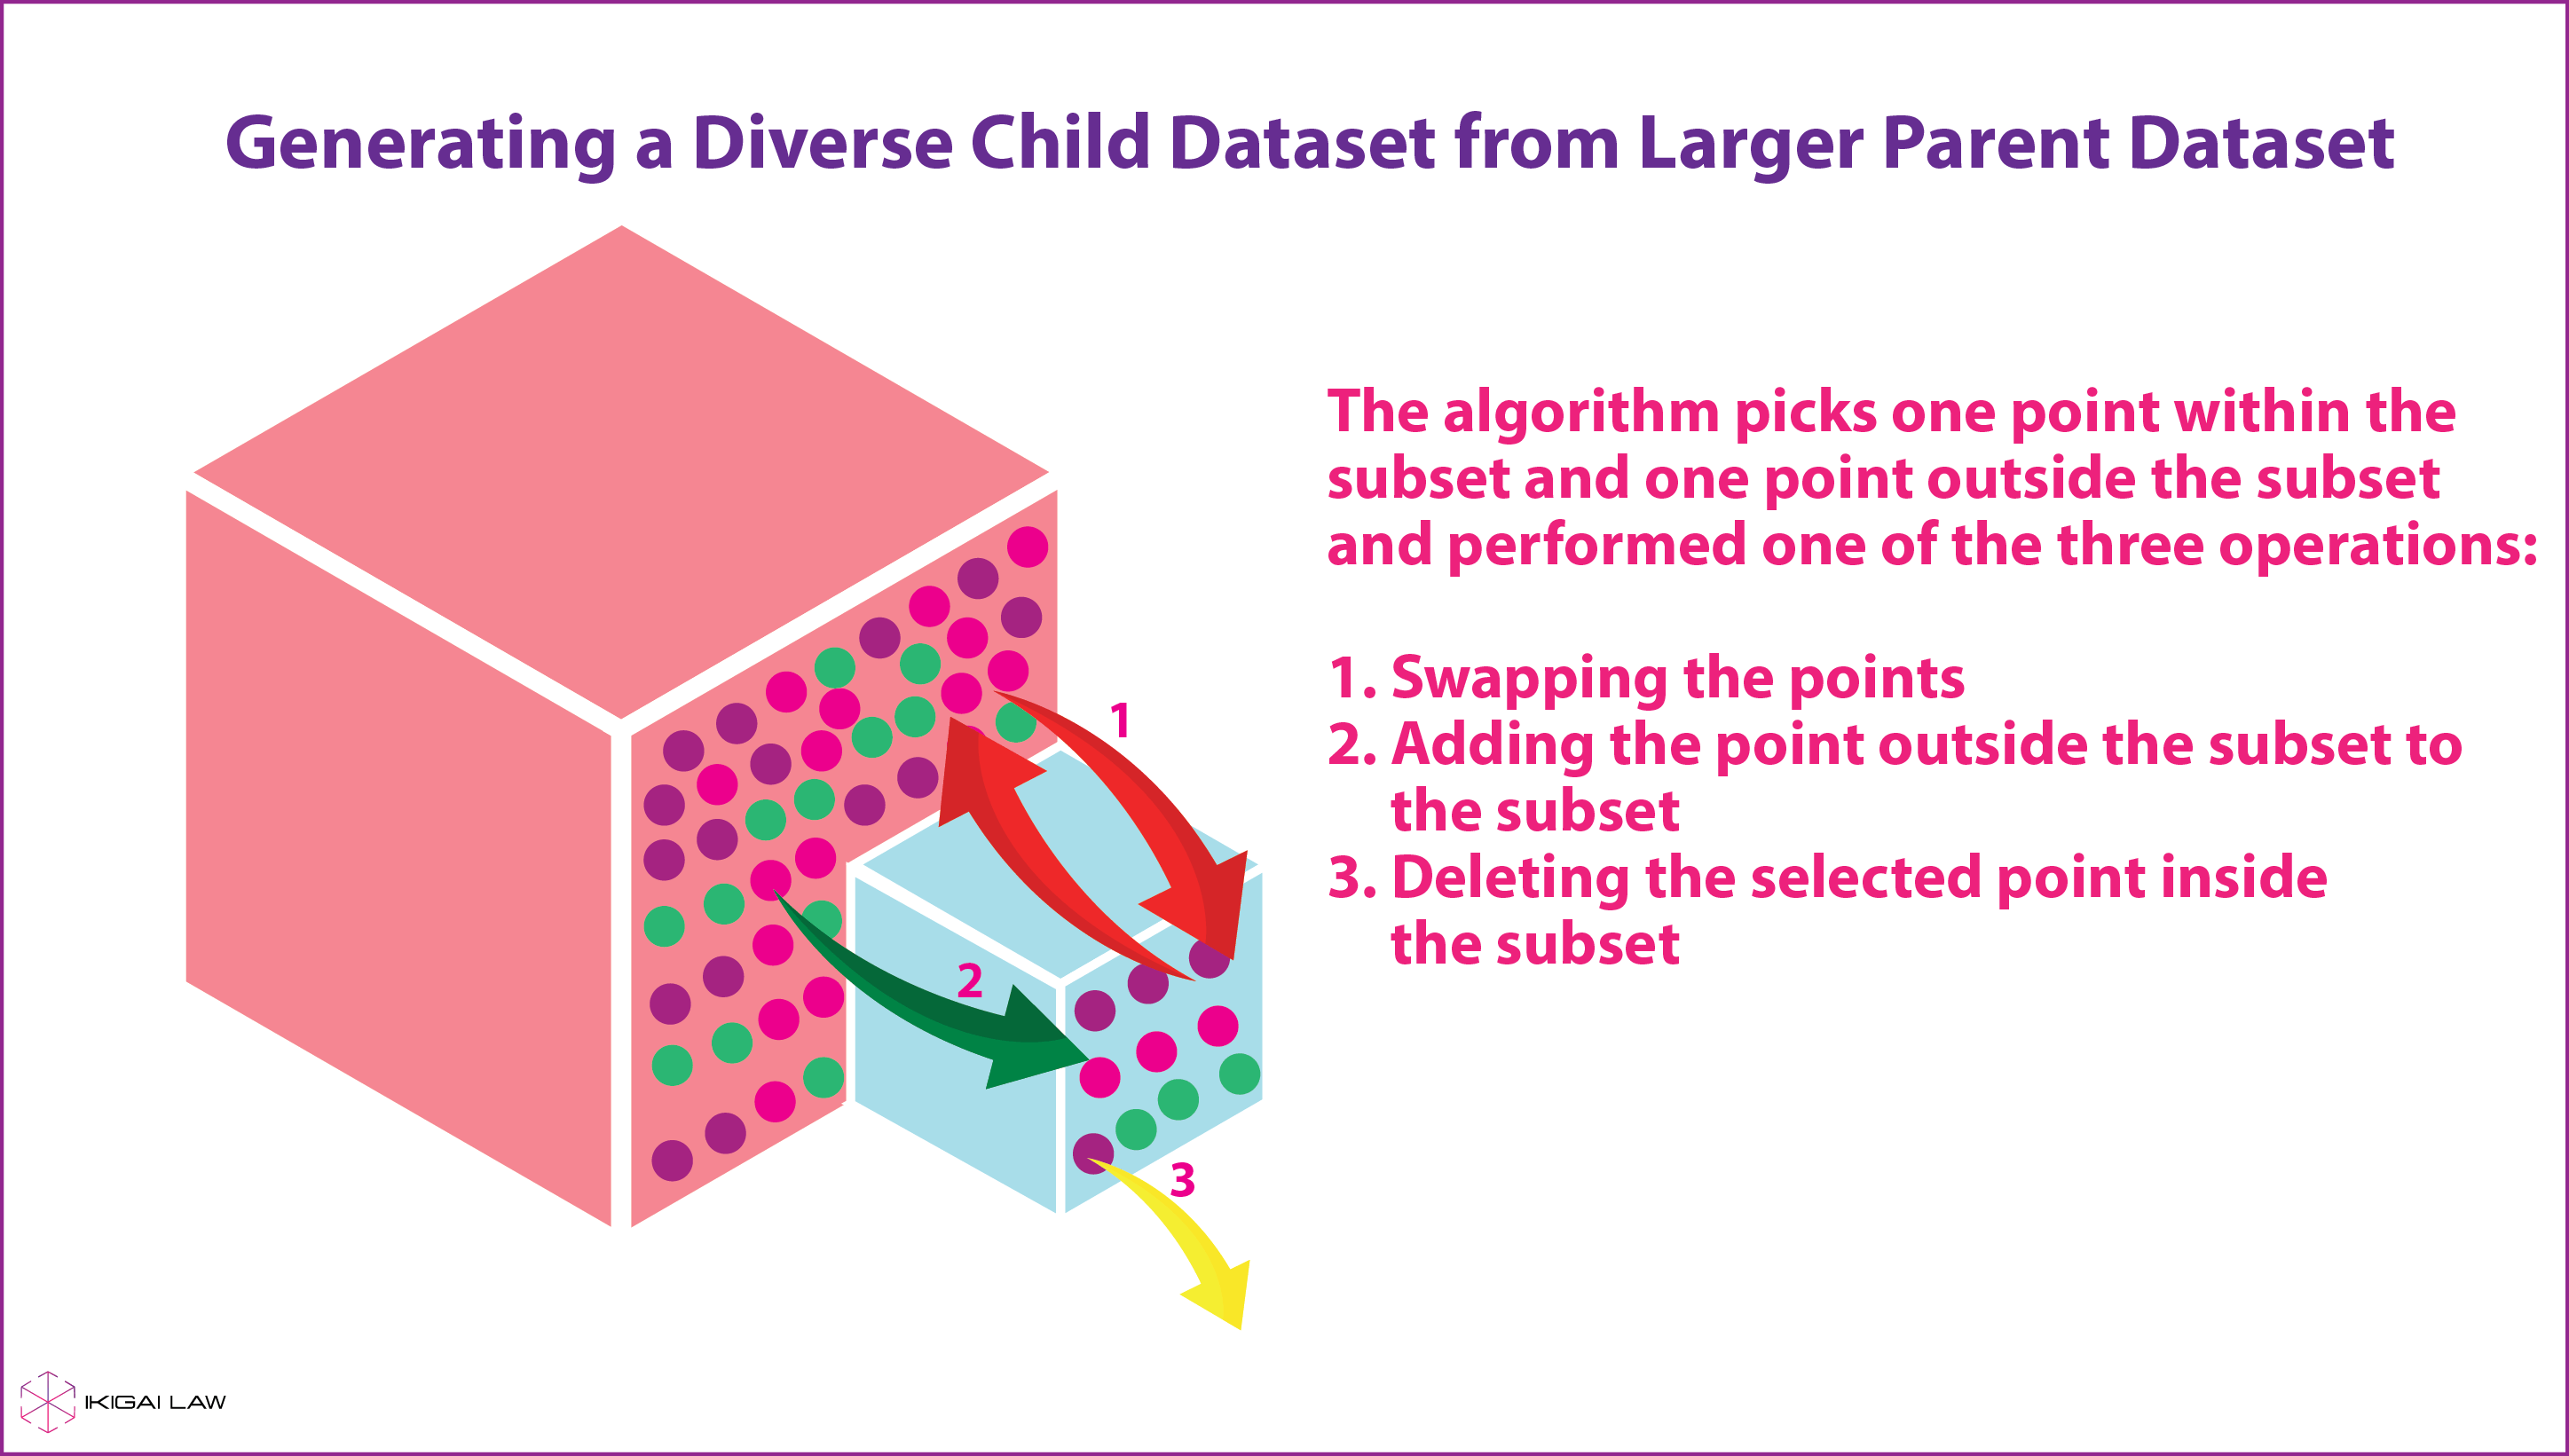
An example of this method can be seen in the work of Prasad et al. (2014) where the researchers reconstructed a small dataset from a large input dataset but more balanced with respect to different labels. One way in which this model is implemented is explained in the infographic below.

To understand this process better, imagine a large box to contain marbles of different colours and a small empty box. The task at hand is to fill the smaller box with marbles from the larger box such that all marbles of different colours end up being well represented. The idea here is to first pick up marbles randomly from the large box and put them into the smaller box and fill it to the brim. Then you select one marble from each of the boxes and perform one of three operations: (a) swap the marbles i.e. you put the marble from larger box into the smaller box and marble from the smaller box into the larger box; (b) You only add the marble from the larger box to the smaller one; (c) You only remove the marble from the smaller box out of the whole system. This process of swapping, adding or removing marbles continues until each operation adds to the diversity of marbles in the small box and only stops when the system reaches an equilibrium such that adding or removing any marble from the small box would result in the diversity of marbles to fall. In practice, this method has shown promising results in case of generating trailers for movies or summarising long documents by including all types of information and ensuring diversity, thereby reducing bias towards dominant labels.
3. Studying latent structures[1].
Consider this example: A building is set on fire. Usually, the number of fire engines that would rush to the location and the cost of the fire damage would appear to be correlated. However, it is actually the rise in the size of the fire that will cause both the fire engines and the cost of loses to increase, therefore negating the initial hypothesis that fire engines and cost of loses were somehow correlated. Here ‘size of the fire’ is the unaccounted latent variable. A latent (“hidden” in Greek) variable is an unmeasured, unseen variable that behaves as a confounder and causes two events X and Y to occur, without which X and Y would appear correlated. Studying latent structures helps us account for the confounder, basis which the correlation between X and Y would usually weaken or become absent and lead us to make appropriate predictions.
An example of this method can be seen in the work of Amini et al. (2019) where the researchers employed a deep learning algorithm to identify underrepresented portions of the training dataset (here publicly available “CelebA” dataset that contains different images of faces usually used to train facial recognition systems) and increased the probability (or chance) of selecting a coloured face as compared to a white face such that it created a balanced dataset with equally represented labels. This is similar to forcing the algorithm to select one coloured face for one white face to maintain a 1:1 ratio despite the original dataset having a 1:10 ratio of coloured faces to white faces. This calculated increase in selecting certain data points (or sampling) is brought about by studying the latent structure within the training dataset. The researchers concluded that their method showed an “increased classification accuracy and decreased categorical bias across race and gender, compared to standard classifiers.”
(Authored by Vihang Jumle, Associate with inputs from Anirudh Rastogi, Founder at Ikigai Law. Infographics created by Akriti Garg, Manager – Communications.)
[1] A latent structure is determined by studying the probabilistic distribution of latent variables of the dataset.


