1. Preliminary
1.1 ‘Budget Speeches Analysis’ is Ikigai Law’s project initiated to (i) identify trends in the word frequency[1] of different key words in India’s budget speeches, and (ii) compare them against trends in different economic performance parameters particular to India. Essentially, this project attempts to apply simple analytical tools to detect patterns in budget speeches, which would otherwise not be explicitly visible to a reader. It also maps whether repeated reference to a given sector in the budget speeches translates to a tangible difference in the growth or promotion of such sectors. In this post, we will identify trends in the word frequency of the term ‘investment’ and compare it against different economic indicators. This is the second post in the ‘Budget Speeches Analysis’ series. The first post can be found here.
2. Scope of analysis
2.1 This post maps the word frequency of ‘investment’ against the gross fixed capital formation (“GFCF”) and foreign direct investments (“FDI”) in India. The time period for analysing investments has been set from 2019 to the earliest year until which reliable data was found. All values used in this post are measured on an annual basis. All union and interim budget speeches of India can be found here. All data used for this project is sourced from the World Bank’s Open Data project and can be found here, here and here.
3. Data source
3.1 The project requires the data to be available on an annual basis, summed up for all Indian sectors and over a longer period of time for the analysis to be fruitful. India’s national data sources though meet the first two criteria, they are not available for a long period of time. The project hence relies on data provided by the World Bank’s Open Data project managed by the Development Data Group of the World Bank. The World Bank works closely with the international community such as the team at the United Nations, International Monetary Fund, regional banks, etc. to source its data.
4. Economic indicators[2] used in this post
4.1 Gross fixed capital formation:
GFCF measures the net increase in the fixed assets of a country. It is often referred to as ‘investments’. The World Bank’s Open Data project defines GFCF as “Gross fixed capital formation (formerly gross domestic fixed investment) includes land improvements (fences, ditches, drains, and so on); plant, machinery, and equipment purchases; and the construction of roads, railways, and the like, including schools, offices, hospitals, private residential dwellings, and commercial and industrial buildings. According to the 1993 SNA, net acquisitions of valuables are also considered capital formation.”
It indicates the amount of new value that is added (or invested) to the economy rather than what is consumed and hence has been used for this analysis.
4.2 Foreign direct investments:
FDI refers to investments made by an entity based in one economy (such as individuals or firms) into businesses located in another economy. Usually, FDI is a result of investors setting up business operations in foreign economies. These may include establishing ownership over firms on foreign lands or controlling interests in a foreign company. The World Bank’s Open Data project defines FDI as “the net inflows of investment to acquire a lasting management interest (10 percent or more of voting stock) in an enterprise operating in an economy other than that of the investor. It is the sum of equity capital, reinvestment of earnings, other long-term capital, and short-term capital as shown in the balance of payments.” FDI also creates stable and long-lasting links between economies.
Since FDI flow allows us to track the domestic money flowing outside India as investments (as outward flow) and foreign money flowing into India as investments (as inward flow) hence both these indicators are used for this analysis.
5. Results
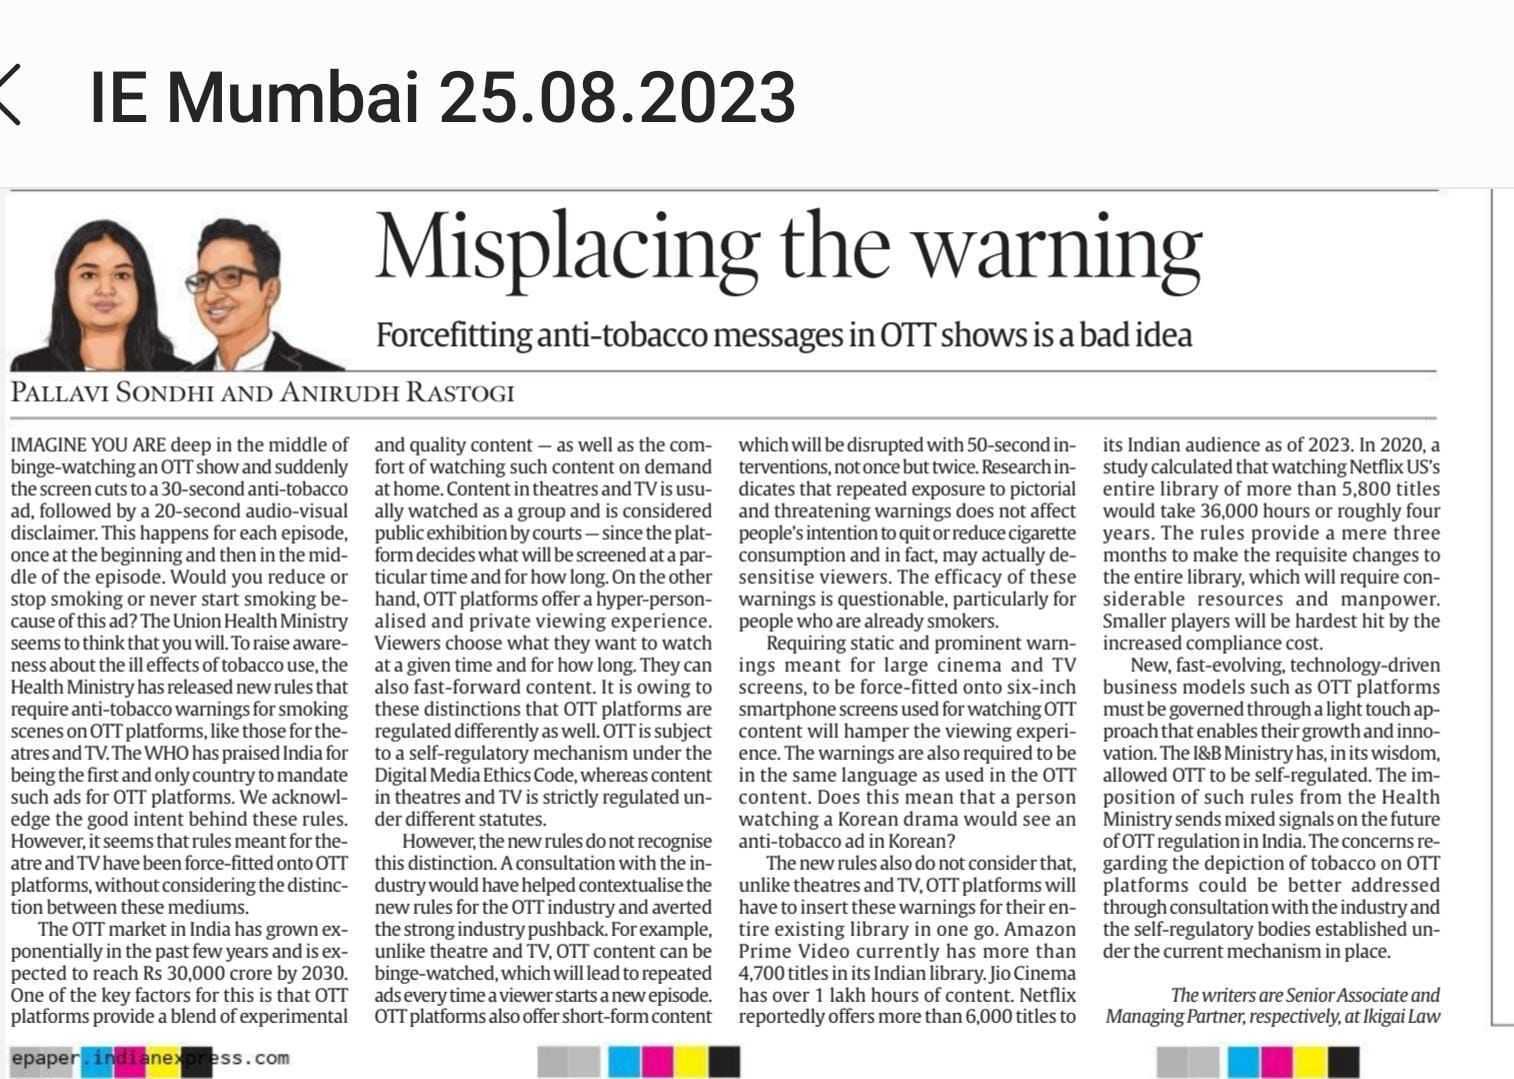
The following graphs focus on comparing the trend in word frequency of ‘investment’ and the trend in GFCF as a % of GDP of India.
5.1 The trend in the word frequency of ‘investment’ is compared to the trend in GFCF (as % of GDP) for each year over a period of five years (2014 – 2018) in the following graph. It is observed that the trends of both these variables[3] (word frequency of ‘investment’ and GFCG (as % of GDP)) do not move in a synchronised manner.
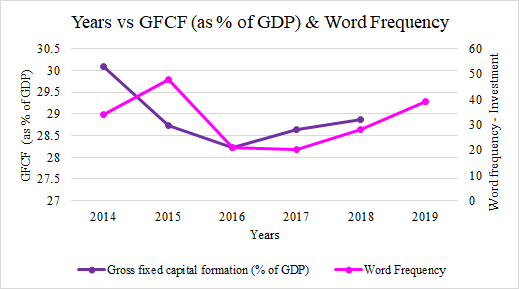
5.2 The trend in the word frequency of ‘investment’ is compared to the trend in GFCF (as % of GDP) for each year over a period of 59 years (1960 – 2018) in the following graph. It is observed that both variables rise in value over time however the variables do not move in a coordinated manner. Moreover, both these variables appear to be weakly correlated. The Pearson correlation coefficient[4] is found to be 0.35 which indicates a weak positive correlation.
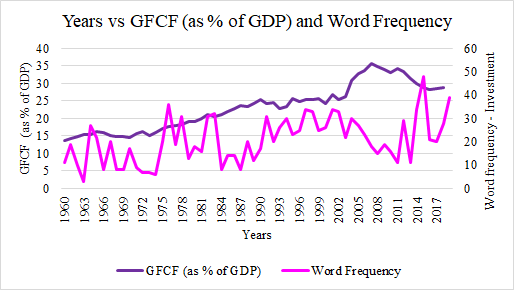
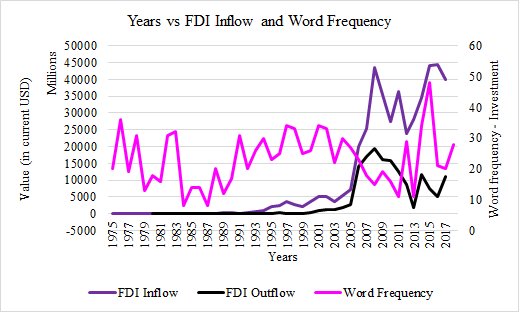
The following graphs focus on comparing the trend in the word frequency of ‘investment’ and the trend in FDI (inward & outward) of India.
5.3 The trend in the word frequency of ‘investment’ is compared to the trend in FDI (inward & outward) for each year over a period of five years (2013 – 2017) in the following graph. It is observed that the variables do not move in a coordinated manner.
5.4 The trend in the word frequency of ‘investment’ is compared to the trend in FDI (inward & outward) for each year over a period of 43 years (1975 – 2017) in the following graph. It is observed word frequency of ‘investment’ is not correlated with either of the two variables. The Pearson correlation coefficient is found to be approximately 0 which indicates a minimal correlation.
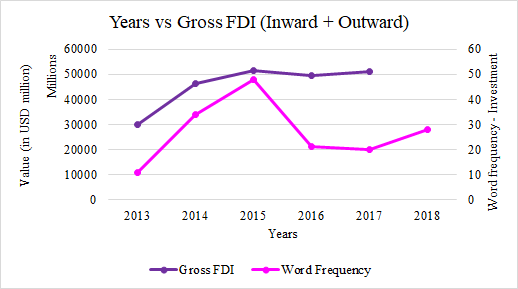
5.5 The trend in the word frequency of ‘investment’ is compared to the trend in gross FDI[5] (inward FDI + outward FDI) for each year over a period of five years (2013 – 2017) in the following graph. It is observed that both variables tend to move in a coordinated manner. An exception, however, can be seen for the year 2017 where both variables move in opposite directions.
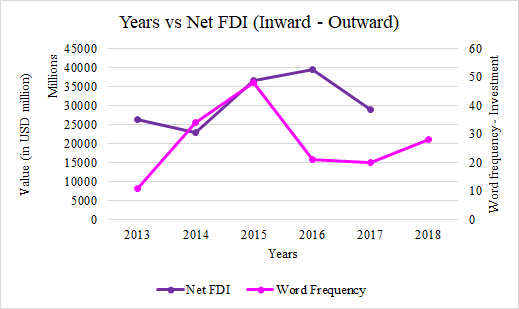
5.6 The trend in the word frequency of ‘investment’ is compared to the trend in net FDI[6] (inward FDI – outward FDI) for each year over a period of five years (2013 – 2017) in the following graph. It is observed that both variables do not move in a coordinated manner.
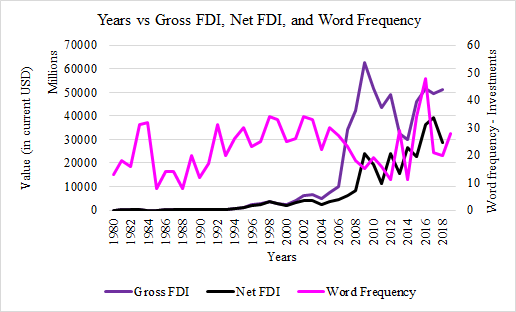
5.7 The trend in the word frequency of ‘investment’ is compared to the trend in gross FDI and net FDI for each year over a period of 37 years (1980 – 2018) in the following graph. It is observed word frequency of ‘investment’ is not correlated with either of the two variables. The Pearson correlation coefficient is found to be approximately 0 which indicates a minimal correlation.
 The following graph compares the trends in the word frequency of ‘investment’ in the interim budget speeches and final union budget speeches for the same year.
5.8 The word frequency of ‘investment’ in the interim budget is compared with the word frequency of ‘investment’ in final union budget speeches for the same years. It is observed that interim budget speeches do not focus on investments as much as union budget speeches do. This difference in word frequency of ‘investment’ may also suggest that investments do not majorly drive voting behaviour in India and hence ruling parties tend to focus less on investment in their budget speeches. It is observed that the years 1996 and 2014 mentioned ‘investment’ in the interim budget a greater number of times compared to other interim budgets. This unconventional word frequency was followed by a change in the ruling party both times. In 1996, the Indian National Congress (“INC”) lost the elections to Bharatiya Janata Party (“BJP”) and similarly, the INC lost the elections to BJP in 2014. In years other than 1996 and 2014 when the interim budget mentioned ‘investment’ comparatively lesser times, the ruling parties were re-elected to power except in 2004 when the National Democratic Alliance (led by BJP) lost the elections to United Progressive Alliance (led by the INC).
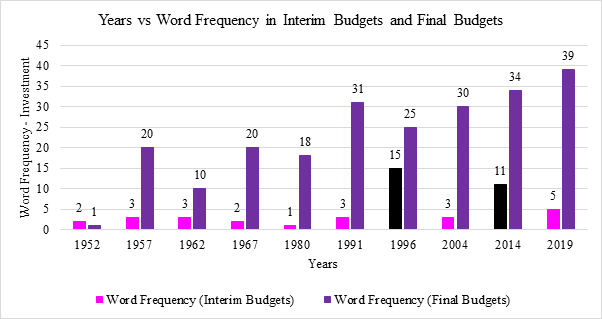
5.9 The average word frequency of ‘investment’ in all union budget speeches from 1947 to 2019 hovers around 18 whereas for the interim budget this value hovers around 3.
6. Conclusions
This analysis tells us that there is little correlation between the number of times the term ‘investment’ is mentioned in budget speeches and the actual inflow of investments into the country. However, it is interesting to note that interim budget speeches do not focus on investments as much as union budget speeches do, possibly because investments do not drive voting behaviour in India. Curiously enough, the years 1996 and 2014 mentioned ‘investment’ in the interim budget a greater number of times and resulted in a change in the ruling party (both times it was the Indian National Congress that lost the elections to the Bharatiya Janata Party).
(Authored by Vihang Jumle, Associate, Ikigai Law with inputs from Tuhina Joshi, Policy Associate; and Anirudh Rastogi, Founder at Ikigai Law.)
[1] For the purposes of this project, the term ‘word frequency’ has been used to denote the number of times a word occurs in a budget speech.
[2] An economic indicator is a statistic that measures economic activity, such as the unemployment rate, the level of industrial production, or the level of output, etc.
[3] A variable here is defined as a dummy that represents an indicator which is being compared on the graph. Here, word frequency and GFCF (as % of GDP) are referred as variables.
[4] A Pearson correlation coefficient of 1 indicates a strong positive correlation whereas -1 indicates a strong negative correlation.
[5] Here gross FDI is defined as the sum of inward FDI and outward FDI
[6] Here net FDI is defined as the difference of inward FDI and outward FDI